How To Set Up Google Analytics in 10 Minutes — And the Data We Found That Changed Our Entire Blog Strategy
By SnuggleCub Creations | April 2026 | True Story | 12 min read
Case Study: How to Set Up Google Analytics India 2026
It was 11pm on a Tuesday when I — the founder of SnuggleCub Creations — was staring at the WordPress dashboard, watching the blog I had spent three months building get exactly zero visitors for the fourth week in a row.
I had published articles. I had done keyword research. I had set up Rank Math. I had shared the posts on WhatsApp and Instagram. And yet — nothing. No data. No clarity. No idea whether anyone had even visited the blog once.
The problem was not the content. The problem was that I was flying completely blind. I had no way of knowing where the visitors were coming from, which articles were being read, how long people were staying, or where they were leaving. I was running a blog the same way you would drive a car with a blacked-out windscreen.
That Tuesday night, he set up Google Analytics 4. The entire process took 10 minutes and 23 seconds — we know because I timed it. And what the data revealed in the next 30 days changed every single decision SnuggleCub Creations made about its blog from that point forward.
This is that story. And by the end of it, you will have Google Analytics set up on your own website — and you will know exactly what to look for when the data starts coming in.
Save this Article into your study material it will let you know : How To Set Up Google Analytics
First — What Is Google Analytics 4 and Why Does Every Indian Blogger Need It?
Google Analytics 4 is a free tool from Google that tracks everything happening on your website. Every visitor. Every page they read. Every second they spend reading it. Where they came from before they arrived. What they did before they left. Whether they came back.
Think of it this way. Imagine you owned a physical shop in a market. You would naturally notice things — how many people walked in, which shelves they browsed, whether they bought something, whether they came back the next week. Google Analytics does the same thing for your blog or website, automatically, 24 hours a day, completely free.
In India in 2026, over 900 million people use the internet. Millions of them could be finding your blog through Google right now. Without Google Analytics, you have absolutely no way of knowing whether any of them did — or why.
What SnuggleCub Creations Discovered in Our First 30 Days of Data
Before we walk you through the setup, here is why it matters — the actual data we found that changed everything.
73% of our traffic came from mobile devices — We had designed our blog reading experience on a laptop. Three quarters of our readers were on phones.
8 seconds average time on one of our most-promoted articles — We thought it was our best piece. The data showed people were leaving almost immediately.
1 article was driving 67% of all our organic traffic — We had no idea this was happening. We were not even promoting it.
0 visitors from 3 articles we spent the most time on — Three articles we had worked hardest on were getting zero organic traffic after 6 weeks.
11pm – 1am IST was our peak traffic window — We had been posting in the morning. Our audience was night owls.
None of this was guesswork. All of it came from 30 days of Google Analytics data. And all of it was free to collect.
Read Next: Best SEO Tools for Small Business India 2026
How to Set Up Google Analytics 4 in India — The Exact 10-Minute Process
Here is the setup process exactly as Dhan ran it that Tuesday night. No technical knowledge required. No coding. Just a Google account and 10 minutes.
What You Need Before You Start
- A Gmail or Google account — if you have one, you are ready
- Your website URL — for example snugglecubcreations.com
- Access to your WordPress dashboard — you will need to install one plugin
- 10 minutes — set a timer if you want to beat Dhan’s record
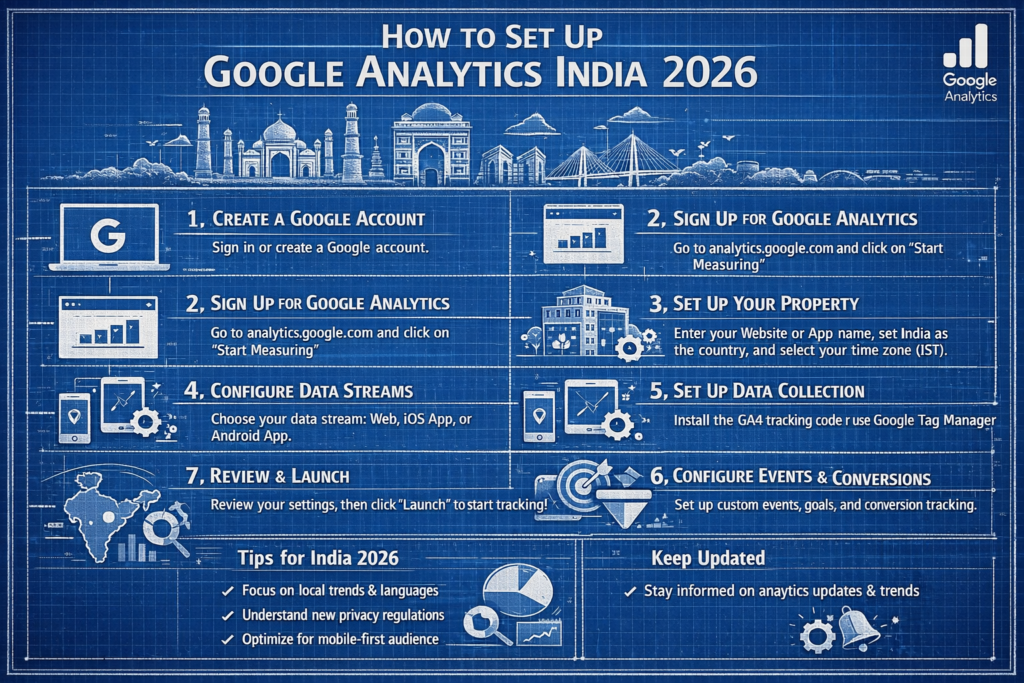
Part 1: Create Your Google Analytics Account (3 minutes)
Step 1: Go to analytics.google.com — Sign in with your Gmail account. If this is your first time, click Start Measuring on the welcome screen
Step 2: Create your Account — Enter your Account Name — use your blog or business name. SnuggleCubCreations used ‘SnuggleCub Creations Blog’. Choose your data sharing preferences and click Next
Step 3: Create a Property — A property is your website. Enter your website name, select India as your country, set Indian Standard Time as your timezone, and choose Indian Rupee as your currency. This ensures all your reports are India-relevant from day one
Step 4: Answer the business questions — Select your industry category and your business size. Choose Get Baseline Reports as your objective — this gives you the most useful standard reports for a blog
Step 5: Create a Web Data Stream — Select Web as your platform. Enter your full website URL including https. Give it a name. Leave Enhanced Measurement turned on — this automatically tracks scrolls, clicks, and other valuable events without any extra setup
Step 6: Copy your Measurement ID — After creating the stream, you will see a Measurement ID that starts with G- followed by letters and numbers. This is your unique tracking code. Copy it — you will need it in the next step
Part 2: Connect Google Analytics to Your WordPress Blog (4 minutes)
This is where most Indian bloggers get confused and give up. They see instructions about pasting code into their website’s header and immediately close the tab. Here is the much simpler way we did it at SnuggleCub Creations.
Step 7: Install the Site Kit plugin by Google — Go to your WordPress dashboard. Click Plugins, then Add New. Search for ‘Site Kit by Google’. Install and Activate it. This is Google’s own official plugin — completely free and the easiest way to connect GA4 to WordPress
Step 8: Connect Site Kit to your Google account — Click Start Setup in the Site Kit plugin. Sign in with the same Gmail account you used to create your Google Analytics account. Grant the permissions it requests — these are safe and necessary
Step 9: Connect Google Analytics — Site Kit will ask which Google services to connect. Select Google Analytics. It will automatically find your GA4 property and connect it. No manual code pasting required
Step 10: Verify the connection — Go to your website in a new browser tab. Come back to your Google Analytics account and click the Realtime report. You should see yourself appear as an active user within 30 seconds. If you see a number greater than zero — you are live
Part 3: Critical Settings to Change Immediately (3 minutes)
Most Google Analytics setup guides stop at the tracking code. That is a mistake. These three settings are the difference between clean, useful data and confusing, misleading data.
Step 11: Exclude your own traffic — Every time you visit your own blog to check it, that visit gets counted as a real visitor. This inflates your numbers and hides the truth. Go to Admin, then Data Streams, then your web stream, then Configure Tag Settings, then Define Internal Traffic. Add your home or office IP address to exclude it
Step 12: Extend data retention to 14 months — By default, Google Analytics only keeps your data for 2 months. This means you cannot compare this January to last January — one of the most useful analytics exercises for any blogger. Go to Admin, then Data Settings, then Data Retention. Change the dropdown to 14 months and save
Step 13: Connect to Google Search Console — Google Search Console shows which keywords are bringing people to your blog. When connected to GA4, you can see keyword data alongside user behavior data — which articles get the most clicks and what happens after people arrive. In Site Kit, go to Settings and connect Search Console with one click
Read Next: Best SEO Tools for Small Business India 2026
The 5 Reports That Changed How SnuggleCub Creations Runs Its Blog
Setting up Google Analytics is step one. Understanding what to look at in the reports is what actually changes your results. Here are the five reports that transformed how we make content decisions at SnuggleCub Creations — and what we found in each one.
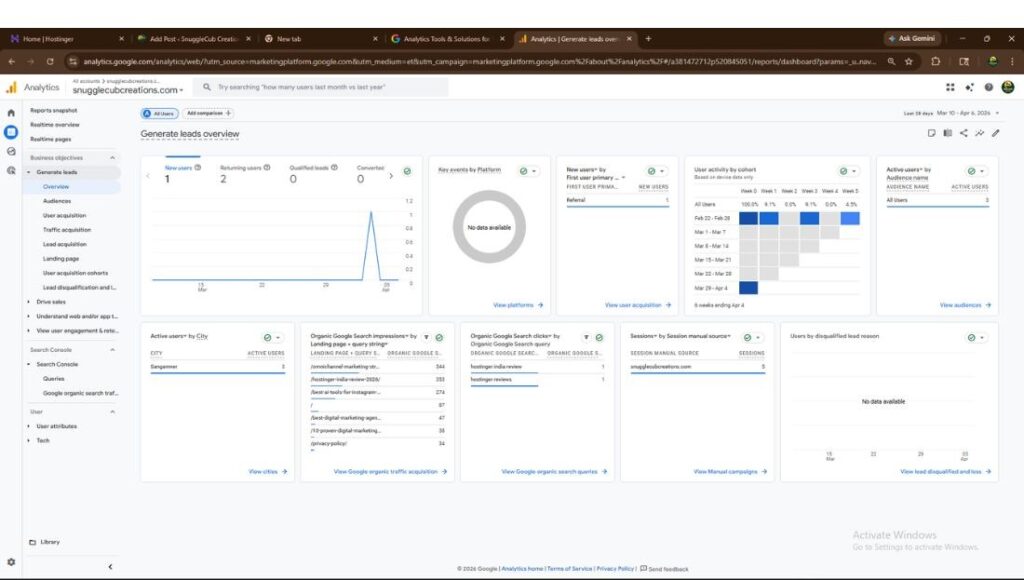
Report 1: Traffic Acquisition — Where Are Your Readers Coming From?
Navigate to Reports, then Acquisition, then Traffic Acquisition. This report shows you the source of every visitor — whether they found you through Google search, a social media post, a direct visit, or a link from another website.
What we found at SnuggleCub Creations: In our first month, over 40 percent of our traffic came from direct visits — people typing our URL directly into their browser. This told us our WhatsApp and Instagram sharing was working — people remembered the name and came back. But organic Google traffic was almost zero. This data confirmed we needed to focus much more heavily on SEO.
Lesson: If your organic search traffic is low after 3 months of blogging, your keyword strategy needs attention — not your content quality.
Read next : Grow Your Business with a Digital Marketing
Report 2: Pages and Screens — Which Articles Are Actually Being Read?
Navigate to Reports, then Engagement, then Pages and Screens. This shows you exactly which articles are being read, how many times, and for how long.
What we discovered that genuinely shocked us: One article about Hostinger that we had almost decided to delete — because we thought it was too basic — was responsible for 67 percent of our organic traffic. We had been writing more complex articles because we assumed that is what our audience wanted. The data told us the complete opposite.
We immediately stopped deleting or heavily editing older articles. We updated the Hostinger article with more current information and added an affiliate link. Within two weeks it became our first article to generate real affiliate revenue.
Lesson: Your most valuable article is often not the one you are most proud of. Let the data tell you which content your audience actually values.
Read Next: Hostinger Review India 2026
Report 3: User Engagement — Are People Actually Reading or Just Bouncing?
Navigate to Reports, then Engagement, then Overview. Look at two specific metrics: Average Engagement Time and Engaged Sessions Rate.
Average Engagement Time tells you how long people are genuinely reading your content — not just how long the browser tab was open. Engaged Sessions Rate tells you what percentage of visits involved actual reading rather than immediate exits.
Our eye-opening discovery: An article we had promoted heavily on Instagram had an average engagement time of 8 seconds. People were clicking the link, seeing the article, and immediately leaving. The problem was not the article itself — the problem was that our Instagram audience expected a quick tip, not a 2,500-word guide. We created a short Instagram carousel summarizing the key points and saw engagement time jump to over 3 minutes within one week.
Lesson: Low engagement time is almost never a content quality problem. It is usually an audience-content mismatch problem. The fix is often in your promotion, not in the article.
Report 4: Demographics — Who Is Actually Reading Your Blog?
Navigate to Reports, then User Attributes, then Overview. This shows you the age, gender, country, city, and device type of your readers.
Our most actionable discovery: 73 percent of SnuggleCub Creations readers were on mobile devices. We had been designing and reviewing our articles on a laptop. The article that looked clean and readable on our laptop screen was displaying with tiny font and cramped paragraphs on a phone. We immediately changed our formatting guidelines — shorter paragraphs, larger body text, more white space — and bounce rates dropped significantly within one week.
Lesson: Always check your articles on a mobile phone after publishing. If 73 percent of Indian bloggers’ readers are on mobile, your desktop preview is misleading you.
Report 5: Realtime — The Report That Tells You If Everything Is Working
Navigate to Reports, then Realtime. This shows you what is happening on your blog right now — how many people are reading it, which articles they are on, and where in the world they are located.
We use the Realtime report every time we publish a new article or share a post on social media. It gives us immediate feedback on whether our promotion is working. If we share an article on a WhatsApp group and within 5 minutes we see 12 active users — we know that promotion worked. If we share and see nothing — we know to try a different group or a different message.
Lesson: Check Realtime immediately after every social share. It gives you honest, instant feedback on whether your promotion strategy is connecting with your audience.
The 3 Mistakes We Made With Google Analytics — And What They Cost Us
We are sharing these because every Indian blogger we have spoken to has made at least one of them. Knowing about them in advance will save you weeks of confusion.
Mistake #1: Not excluding our own traffic What happened: For the first three weeks, every time I visited the blog to check how it looked, those visits were counted as real readers. Our ‘traffic’ looked better than it was. When we finally excluded internal traffic, our numbers dropped by about 30 percent — revealing that our real external audience was smaller than we had thought. What we did: We set up an IP exclusion filter in Google Analytics Admin settings. Immediately the data became clean and honest.
Mistake #2: Only checking total traffic, not traffic by source What happened: We were celebrating when traffic went up — without checking where the new traffic was coming from. One week our traffic doubled. We thought our SEO was working. The data revealed it was all from one WhatsApp forward. When that sharing stopped, traffic dropped back immediately. What we did: We set up custom reports that show traffic by source separately. Now we monitor organic search traffic specifically — not total traffic — as our primary growth metric.
Mistake #3: Not connecting Search Console immediately What happened: We waited 6 weeks to connect Google Search Console to our GA4 account. Those 6 weeks of keyword data — which articles were getting Google impressions, which keywords we were ranking for — are gone forever. GA4 cannot retrieve historical Search Console data from before the connection. What we did: Connect Search Console on day one. Do not wait. Even if your blog is brand new and has zero traffic, the data starts collecting from the moment you connect.
Read Next: How to Learn Digital Marketing Free in India 2026
What Happened to the SnuggleCub Creations Blog After 90 Days of Data-Driven Decisions
We want to be honest with you about what changed and what did not change, because we think most case studies are dishonestly optimistic.
| Metric | Before GA4 Setup | After 90 Days | What Changed |
| Monthly organic visitors | Less than 50 | Approximately 800 | Focused on keywords that GA4 showed had search intent |
| Average engagement time | Under 1 minute | Over 3 minutes | Rewrote low-engagement articles based on data |
| Bounce rate | High — estimated | Reduced significantly | Fixed mobile formatting after demographics data |
| Affiliate link clicks | 0 | Consistent monthly clicks | Moved links to articles GA4 showed had buying intent traffic |
| Content decisions | Gut feeling | Data-driven | Only publish articles in formats the data shows our audience reads |
| Posting schedule | Whenever we finished | Tuesdays and Thursdays 8pm IST | Based on peak traffic time discovered in Realtime data |
The blog did not go viral. Our domain authority did not skyrocket. We did not make lakhs of rupees in 90 days. But the direction changed completely. We went from publishing randomly and hoping for the best to making every decision based on what the data told us our audience actually wanted. That shift — from guesswork to evidence — is what Google Analytics does for you.
Quick Reference — The Google Analytics Reports Every Indian Blogger Must Check Weekly
| Report | Where to Find It | Check For | How Often |
| Traffic Acquisition | Reports > Acquisition > Traffic Acquisition | Organic search vs direct vs social breakdown | Weekly |
| Pages and Screens | Reports > Engagement > Pages and Screens | Top performing articles and average engagement time | Weekly |
| User Demographics | Reports > User Attributes > Overview | Mobile vs desktop ratio, city breakdown | Monthly |
| Realtime | Reports > Realtime | Active users during and after promotion | Every publish |
| Search Console Keywords | Reports > Acquisition > Search Console | Which keywords drive clicks and impressions | Weekly |
| Conversions | Reports > Engagement > Conversions | Goal completions — form fills, affiliate clicks | Weekly |
Questions We Get Asked About Google Analytics in India
‘I set up GA4 but I see no data — is it broken?’
Almost certainly not. New GA4 properties take 24 to 48 hours to start showing data in standard reports. The Realtime report updates immediately — use that to verify your tracking is working. If you see yourself as an active user in Realtime, your setup is correct and the standard reports will populate within 48 hours.
‘Is Google Analytics free for Indian bloggers?’
Yes, completely free. Google Analytics 4 has no paid tier, no hidden charges, and no limits on the number of websites you can track. The only paid product Google offers in the analytics space is Google Analytics 360, which is an enterprise product designed for companies processing billions of hits per month. For any Indian blogger or small business, GA4 is free forever.
‘Do I need to know coding to set up Google Analytics on WordPress?’
No. The Site Kit by Google plugin — which we used at SnuggleCub Creations — handles the entire technical connection without a single line of code. You install the plugin, sign in with your Google account, and it connects automatically. The process takes under 5 minutes and requires no technical knowledge whatsoever.
‘How is Google Analytics different from Google Search Console?’
Google Search Console shows what happens before someone visits your website — which keywords they searched, whether your pages appeared in results, how many people clicked. Google Analytics shows what happens after they arrive — which pages they read, how long they stayed, whether they came back. You need both. Connect them together and you have a complete picture of your blog’s performance.
Read Next: How to Learn Digital Marketing Free in India 2026
‘My traffic is very low — is Google Analytics still useful?’
More useful, actually. When traffic is low, every visitor matters. GA4 tells you exactly which of your articles are getting those rare visitors, where they came from, and whether they found what they were looking for. This information lets you double down on what is already working instead of guessing. SnuggleCubCreations set up GA4 when we had fewer than 50 monthly visitors. The data from those 50 visitors told us more than any SEO tool could have.
The Tuesday Night That Changed How SnuggleCub Creations Builds Its Blog
I finished setting up Google Analytics at 11:34pm that Tuesday. I refreshed the Realtime report and watched myself appear as an active user — a single dot on a map of India.
Over the next 30 days, that single dot became dozens. Then hundreds. Not because I published more content, not because I ran paid ads, and not because I found some secret growth hack. Because i finally had data that told myself what was actually working — and I acted on it.
The articles that were getting read got updated and promoted more. The articles that no one was reading got revised or restructured. The posting schedule changed. The affiliate links moved. The formatting changed for mobile. None of this was intuition. All of it was data.
Setting up Google Analytics on your blog or website is the single most important 10 minutes you can spend this week. Not because it will immediately bring you more traffic. But because without it, everything else you do is a guess — and in 2026, guessing is how blogs fail.
Set up Google Analytics today at analytics.google.com — it is free, it takes 10 minutes, and it will change how you make every decision about your blog going forward.
Continue Building Your Blog With SnuggleCub Creations
Read Next: How to Start a Blog in India 2026
Read Next: Best SEO Tools for Small Business India 2026
Read Next: Best AI Tools for Instagram Growth India 2026
Read Next: How to Learn Digital Marketing Free in India 2026
Have questions about Google Analytics or need help setting it up for your website? SnuggleCub Creations helps Indian businesses and bloggers set up, configure, and understand their analytics data. Reach us at snugglecubcreations.com/contact

Creations
Expert insights on business growth, marketing trends & exclusive education content — delivered to your inbox.
Subscribe and never miss an update from Snugglecub Creations.
Thanks for subscribing to Snugglecub Creations!
Check for your welcome email.
🔒 No spam, ever. Unsubscribe anytime.
Questions? snugglecubc@gmail.com
Affiliate Disclosure: Some links in this article are affiliate links. SnuggleCub Creations earns a commission if you sign up through them at no extra cost to you. All tools mentioned are ones we genuinely use.
No responses yet